[JAVA]-JFreeChart报表插件
[JAVA]-JFreeChart报表插件
[TOC]
基本概念
介绍:
JFreeChart是JAVA平台上的一个开放的图表绘制类库。它完全使用JAVA语言编写,是为applications、applets、servlets 以及JSP等使用所设计。JFreeChart可生成饼图(pie charts)、柱状图(bar charts)、散点图(scatter plots)、时序图(time series)、甘特图(Gantt charts)等等多种图表,并且可以产生PNG和JPEG格式的输出,还可以与PDF和EXCEL关联。
获取:
JFreeChart 是JFreeChart公司在开源网站SourceForge.net上的一个项目,该公司的主要产品有如下:
1.JFreeReport :报表解决工具
2.JFreeChart:Java 图形解决方案(Application/Applet/Servlet/Jsp)
3.JCommon :JFreeReport和JFreeChart的公共类库
4.JFreeDesigner :JFreeReport的报表设计工具
功能介绍:
JFreeChart 目前是最好的java图形解决方案,基本能够解决目前的图形方面的需求,主要包括如下几个方面:
pie charts (2D and 3D) :饼图(平面和立体)
bar charts (regular and stacked, with an optional 3D effect) :柱状图
line and area charts :曲线图
scatter plots and bubble charts
time series, high/low/open/close charts and candle stick charts :时序图
combination charts :复合图
Pareto charts :排列图
Gantt charts :甘特图
wind plots, meter charts and symbol charts :符号表图
wafer map charts ( 态图表,饼图(二维和三维) , 柱状图 ( 水平,垂直),线图,点图,时间变化图,甘特图, 股票行情图,混和图, 温度计图, 刻度图等常用商用图表)
JFreeChart核心类库介绍:
研究jfreechart源码发现源码的主要由两个大的包组成:org.jfree.chart、org.jfree.data。其中前者主要与图形本身有关,后者与图形显示的数据有关。核心类主要有: org.jfree.chart.JFreeChart :图表对象,任何类型的图表的最终表现形式都是在该对象进行一些属性的定制。JFreeChart引擎本身提供了一个工厂类用于创建不同类型的图表对象 org.jfree.data.category.XXXDataSet: 数据集对象,用于提供显示图表所用的数据。根据不同类型的图表对应着很多类型的数据集对象类 org.jfree.chart.plot.XXXPlot :图表区域对象,基本上这个对象决定着什么样式的图表,创建该对象的时候需要Axis、Renderer以及数据集对象的支持 org.jfree.chart.axis.XXXAxis :用于处理图表的两个轴:纵轴和横轴 org.jfree.chart.render.XXXRender :负责如何显示一个图表对象 org.jfree.chart.urls.XXXURLGenerator: 用于生成Web图表中每个项目的鼠标点击链接 XXXXXToolTipGenerator: 用于生成图象的帮助提示,不同类型图表对应不同类型的工具提示类
测试案例
【1】开发说明
a.jar包的引入
jfreechart-1.0.13.jar、jcommon-1.0.16.jar、gnujaxp.jar(可考虑不用)
b.代码编写
用JFreeChart生成的各种图表,可以直接保存成为本地的一个图片(.jpeg .png等格式),也可以直接显示到图形用户界面, 还可以显示在jsp网页上。
构建步骤说明如下:
(1)建立Dataset:将所想要显示的数据都放到这个库中
(2)建立JFreeChart对象:将dataset填入到这个对象中
(3)设置各种JFreeChart的属性和效果:通过它提供的各种方法和接口设置相关的属性
(4)生成图表
【2】案例参考
🔗案例1:柱状图的简单显示和图表图片生成
public class BarChartDemo {
public static void main(String[] args) {
// 1. 得到数据
CategoryDataset dataset = getDataSet();
// 2. 构造chart
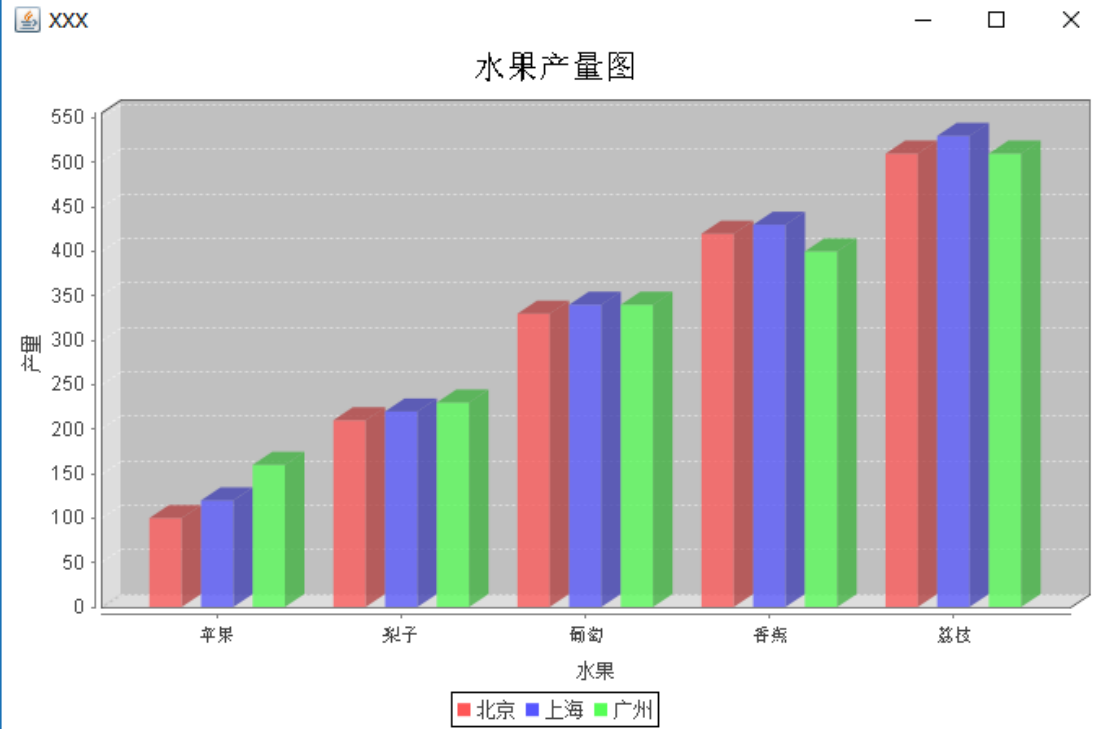
JFreeChart chart = ChartFactory.createBarChart3D("水果产量图", // 图表标题
"水果", // 目录轴的显示标签--横轴
"产量", // 数值轴的显示标签--纵轴
dataset, // 数据集
PlotOrientation.VERTICAL, // 图表方向:水平、
true, // 是否显示图例(对于简单的柱状图必须
false, // 是否生成工具
false // 是否生成URL链接
);
// 3. 处理chart中文显示问题
processChart(chart);
// 4. chart输出图片
writeChartAsImage(chart);
// 5. chart 以swing形式输出
ChartFrame pieFrame = new ChartFrame("XXX", chart);
pieFrame.pack();
pieFrame.setVisible(true);
}
/**
* 获取一个演示用的组合数据集对象
*/
private static CategoryDataset getDataSet() {
DefaultCategoryDataset dataset = new DefaultCategoryDataset();
dataset.addValue(100, "北京", "苹果");
dataset.addValue(120, "上海", "苹果");
dataset.addValue(160, "广州", "苹果");
dataset.addValue(210, "北京", "梨子");
dataset.addValue(220, "上海", "梨子");
dataset.addValue(230, "广州", "梨子");
dataset.addValue(330, "北京", "葡萄");
dataset.addValue(340, "上海", "葡萄");
dataset.addValue(340, "广州", "葡萄");
dataset.addValue(420, "北京", "香蕉");
dataset.addValue(430, "上海", "香蕉");
dataset.addValue(400, "广州", "香蕉");
dataset.addValue(510, "北京", "荔枝");
dataset.addValue(530, "上海", "荔枝");
dataset.addValue(510, "广州", "荔枝");
return dataset;
}
/**
* 解决图表汉字显示问题
*/
private static void processChart(JFreeChart chart) {
CategoryPlot plot = chart.getCategoryPlot();
CategoryAxis domainAxis = plot.getDomainAxis();
ValueAxis rAxis = plot.getRangeAxis();
chart.getRenderingHints().put(RenderingHints.KEY_TEXT_ANTIALIASING,
RenderingHints.VALUE_TEXT_ANTIALIAS_OFF);
TextTitle textTitle = chart.getTitle();
textTitle.setFont(new Font("宋体", Font.PLAIN, 20));
domainAxis.setTickLabelFont(new Font("sans-serif", Font.PLAIN, 11));
domainAxis.setLabelFont(new Font("宋体", Font.PLAIN, 12));
rAxis.setTickLabelFont(new Font("sans-serif", Font.PLAIN, 12));
rAxis.setLabelFont(new Font("宋体", Font.PLAIN, 12));
chart.getLegend().setItemFont(new Font("宋体", Font.PLAIN, 12));
// renderer.setItemLabelGenerator(new LabelGenerator(0.0));
// renderer.setItemLabelFont(new Font("宋体", Font.PLAIN, 12));
// renderer.setItemLabelsVisible(true);
}
/**
* 输出图表数据为图片,可以有指定的格式
*/
private static void writeChartAsImage(JFreeChart chart) {
FileOutputStream fos_jpg = null;
try {
fos_jpg = new FileOutputStream("D:\\fruit.jpg");
ChartUtilities.writeChartAsJPEG(fos_jpg, 1, chart, 400, 300, null);
} catch (Exception e) {
e.printStackTrace();
} finally {
try {
fos_jpg.close();
} catch (Exception e) {
}
}
}
}
结果展示:
🔗案例2:柱状图的具体数值显示
public class BarChart {
public static void main(String[] args) {
//generate the dataset
DefaultCategoryDataset dataset = new DefaultCategoryDataset();
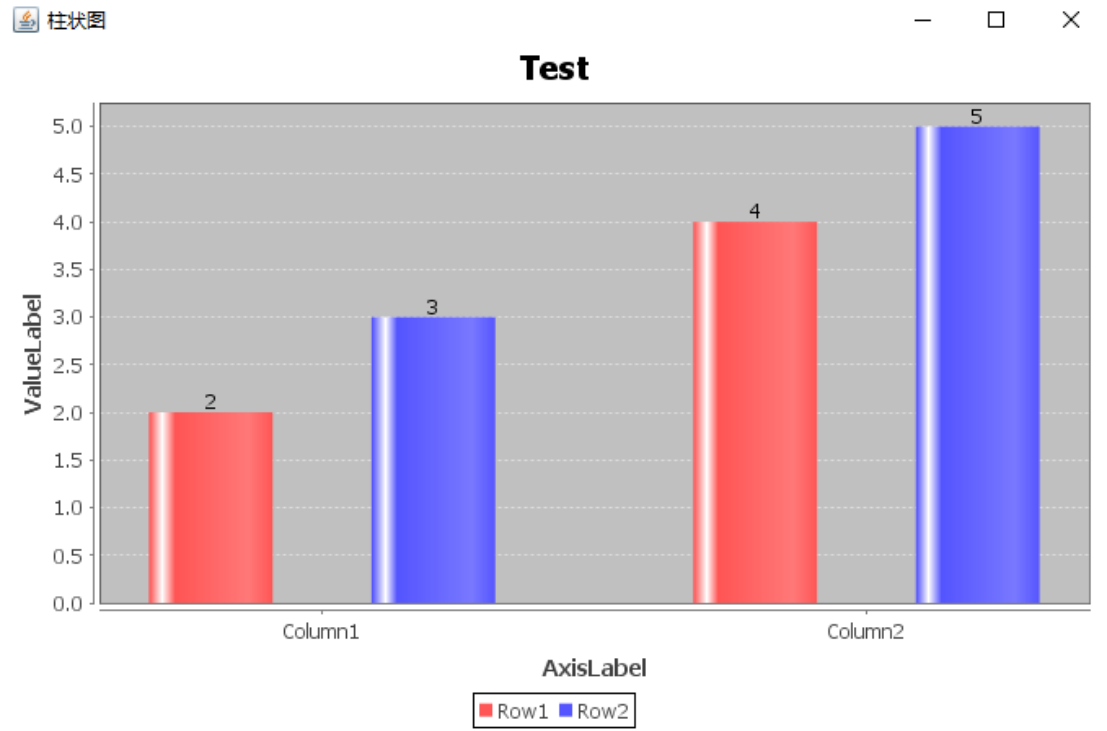
dataset.addValue(2.0, "Row1", "Column1");
dataset.addValue(3.0, "Row2", "Column1");
dataset.addValue(4.0, "Row1", "Column2");
dataset.addValue(5.0, "Row2", "Column2");
//generate the chart
JFreeChart chart = ChartFactory.createBarChart("Test", "AxisLabel",
"ValueLabel", dataset, PlotOrientation.VERTICAL, true, true,
false);
CategoryPlot plot = (CategoryPlot) chart.getCategoryPlot();
BarRenderer renderer = (BarRenderer) plot.getRenderer();
//显示条目标签
renderer.setBaseItemLabelsVisible(true);
//设置条目标签生成器,在JFreeChart1.0.6之前可以通过renderer.setItemLabelGenerator(CategoryItemLabelGenerator generator)方法实现,但是从版本1.0.6开始有下面方法代替
renderer
.setBaseItemLabelGenerator(new StandardCategoryItemLabelGenerator());
//设置条目标签显示的位置,outline表示在条目区域外,baseline_center表示基于基线且居中
renderer.setBasePositiveItemLabelPosition(new ItemLabelPosition(
ItemLabelAnchor.OUTSIDE12, TextAnchor.BASELINE_CENTER));
ChartFrame frame = new ChartFrame("柱状图", chart);
frame.pack();
frame.setVisible(true);
}
}
结果展示:
🔗案例3:饼状图的数据显示和图片生成
普通饼状图:
public class JFreeChartDemo {
public static void main(String[] args) {
DefaultPieDataset dpd = new DefaultPieDataset(); // 建立一个默认的饼图
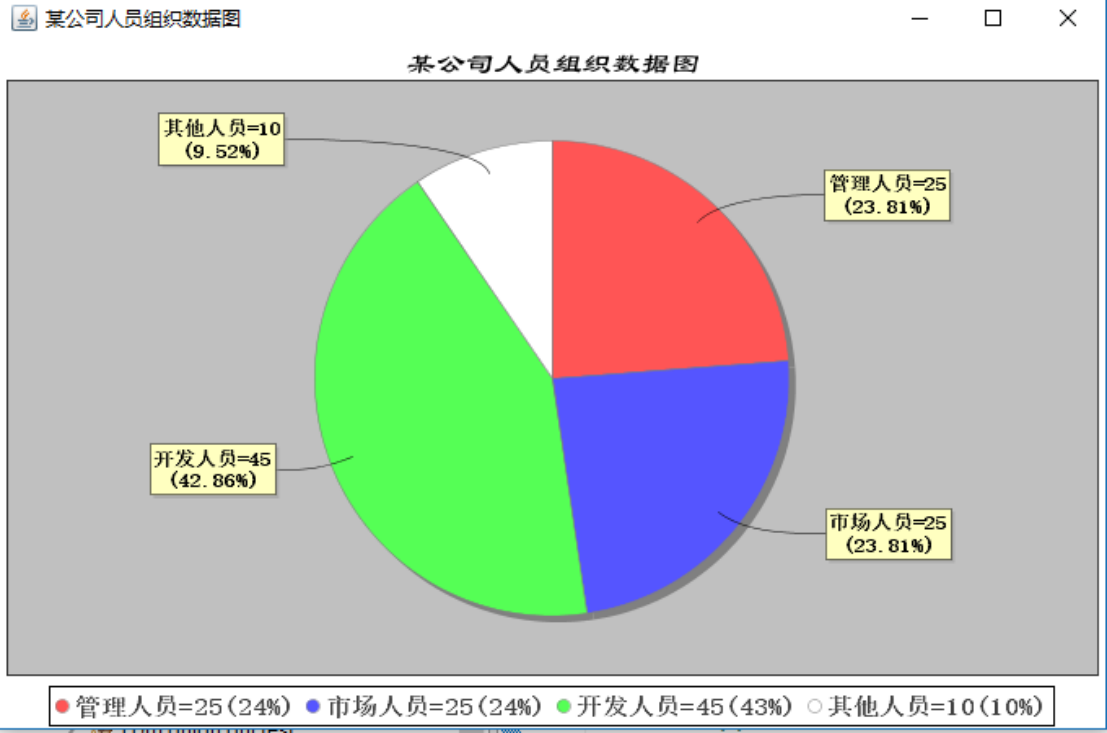
dpd.setValue("管理人员", 25); // 输入数据
dpd.setValue("市场人员", 25);
dpd.setValue("开发人员", 45);
dpd.setValue("其他人员", 10);
JFreeChart chart = ChartFactory.createPieChart("某公司人员组织数据图", dpd, true,
true, false);
// 可以查具体的API文档,第一个参数是标题,第二个参数是一个数据集,第三个参数表示是否显示Legend,第四个参数表示是否显示提示,第五个参数表示图中是否存在URL
// 解决中文显示问题
Font titleFont = new Font("隶书", Font.ITALIC, 18);
Font font = new Font("宋体", Font.BOLD, 12);
Font legendFont = new Font("宋体", Font.BOLD, 15);
chart.getTitle().setFont(titleFont);
chart.getLegend().setItemFont(legendFont);
// 设置饼状图的相关属性
PiePlot plot = (PiePlot) chart.getPlot();
// 设置字体
plot.setLabelFont(font);
// 设置无数据时的信息
plot.setNoDataMessage("无对应的数据,请重新查询。");
// 设置无数据时的信息显示颜色
plot.setNoDataMessagePaint(Color.red);
// 去掉lable(默认是显示对应的名称,可通过设置显示相应的内容)
plot.setLabelGenerator(null);
// 去掉标签连接线
// plot.setLabelLinksVisible(false);
// 图片中显示百分比:自定义方式,{0} 表示选项, {1} 表示数值, {2} 表示所占比例 ,小数点后两位
plot.setLabelGenerator(new StandardPieSectionLabelGenerator(
"{0}={1}({2})", NumberFormat.getNumberInstance(),
new DecimalFormat("0.00%")));
// 图例显示百分比:自定义方式, {0} 表示选项, {1} 表示数值, {2} 表示所占比例
plot.setLegendLabelGenerator(new StandardPieSectionLabelGenerator(
"{0}={1}({2})"));
// 饼图标签显示百分比方法
// plot.setLabelGenerator(new StandardPieSectionLabelGenerator("{2}"));
// 饼图标签使用百分比显示,保留一位小数
// plot.setLabelGenerator(new StandardPieSectionLabelGenerator("{2}",
// new DecimalFormat("0.0"), new DecimalFormat("0.0%")));
// 图片中显示百分比:自定义方式,{0} 表示选项, {1} 表示数值, {2} 表示所占比例 ,小数点后两位
// 显示对应的实际数值
// plot.setLabelGenerator(new StandardPieSectionLabelGenerator("{1}"));
// 设置第一个 饼块section 的开始位置,默认是12点钟方向
plot.setStartAngle(90);
// // 设置分饼颜色
// plot.setSectionPaint(字符串数据, 分饼颜色);
plot.setSectionPaint("其他人员", new Color(255, 255, 255));
// 亦可导出图片数据到指定的路径中
writeChartAsImage(chart); // 先将数据图导出,否则有时存在空指针异常
// 将数据显示在JFrame界面上
ChartFrame chartFrame = new ChartFrame("某公司人员组织数据图", chart);
// chart要放在Java容器组件中,ChartFrame继承自java的Jframe类。该第一个参数的数据是放在窗口左上角的,不是正中间的标题。
chartFrame.pack(); // 以合适的大小展现图形
chartFrame.setVisible(true);// 图形是否可见
}
private static void writeChartAsImage(JFreeChart chart) {
// 用不同的方式导出jpg、png图片格式
FileOutputStream fos_jpg = null;
File file_png = null;
File file_jpg = null;
try {
fos_jpg = new FileOutputStream("D:\\manager.jpg");
file_png = new File("D:\\manager.png");
file_jpg = new File("D:\\manager1.jpg");
// 如果是File类型的文件,需要先判断指定的File是否存在,不存在则相应的创建文件
if (!file_png.exists()) {
file_png.createNewFile();
}
if (!file_jpg.exists()) {
file_jpg.createNewFile();
}
// 导出图像、数目、数据、图像大小
ChartUtilities.writeChartAsJPEG(fos_jpg, 1, chart, 400, 300, null);
ChartUtilities.saveChartAsPNG(file_png, chart, 400, 300);
ChartUtilities.saveChartAsJPEG(file_jpg, chart, 400, 300);
} catch (Exception e) {
e.printStackTrace();
} finally {
try {
fos_jpg.close();
} catch (Exception e) {
}
}
}
}
结果展示:
🔗案例4:折线图的数据显示
参考实现1:
public class LineDemo {
public static void main(String[] args) {
StandardChartTheme mChartTheme = new StandardChartTheme("CN");
mChartTheme.setLargeFont(new Font("黑体", Font.BOLD, 20));
mChartTheme.setExtraLargeFont(new Font("宋体", Font.PLAIN, 15));
mChartTheme.setRegularFont(new Font("宋体", Font.PLAIN, 15));
ChartFactory.setChartTheme(mChartTheme);
CategoryDataset mDataset = GetDataset();
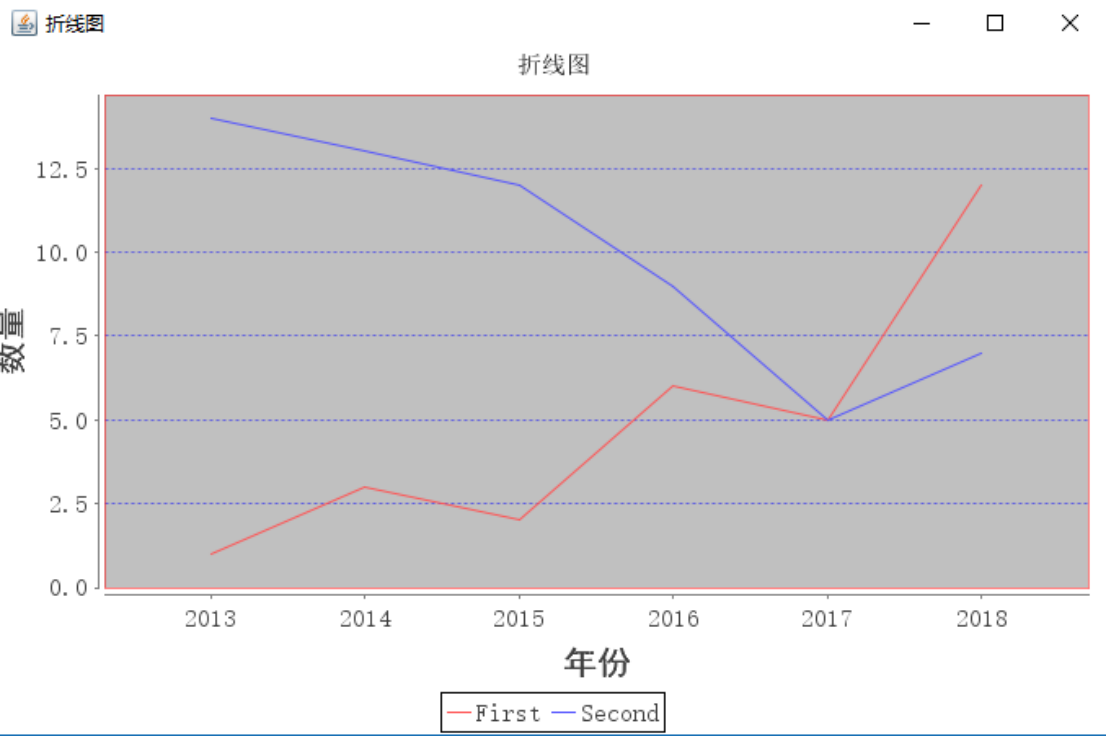
JFreeChart mChart = ChartFactory.createLineChart("折线图",// 图名字
"年份",// 横坐标
"数量",// 纵坐标
mDataset,// 数据集
PlotOrientation.VERTICAL, true, // 显示图例
true, // 采用标准生成器
false);// 是否生成超链接
CategoryPlot mPlot = (CategoryPlot) mChart.getPlot();
mPlot.setBackgroundPaint(Color.LIGHT_GRAY);
mPlot.setRangeGridlinePaint(Color.BLUE);// 背景底部横虚线
mPlot.setOutlinePaint(Color.RED);// 边界线
ChartFrame mChartFrame = new ChartFrame("折线图", mChart);
mChartFrame.pack();
mChartFrame.setVisible(true);
}
public static CategoryDataset GetDataset() {
DefaultCategoryDataset mDataset = new DefaultCategoryDataset();
mDataset.addValue(1, "First", "2013");
mDataset.addValue(3, "First", "2014");
mDataset.addValue(2, "First", "2015");
mDataset.addValue(6, "First", "2016");
mDataset.addValue(5, "First", "2017");
mDataset.addValue(12, "First", "2018");
mDataset.addValue(14, "Second", "2013");
mDataset.addValue(13, "Second", "2014");
mDataset.addValue(12, "Second", "2015");
mDataset.addValue(9, "Second", "2016");
mDataset.addValue(5, "Second", "2017");
mDataset.addValue(7, "Second", "2018");
return mDataset;
}
}
结果展示:
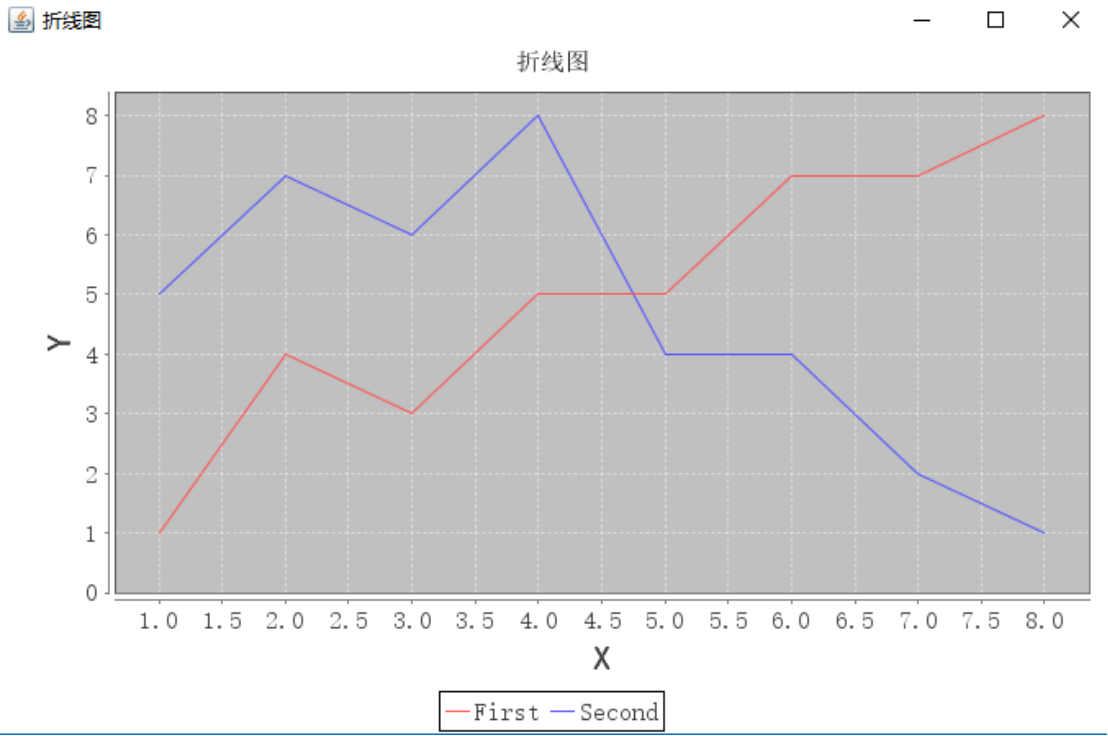
参考实现2:
public class XYLine {
	public static void main(String[] args) {
		StandardChartTheme mChartTheme = new StandardChartTheme("CN");
		mChartTheme.setLargeFont(new Font("黑体", Font.BOLD, 20));
		mChartTheme.setExtraLargeFont(new Font("宋体", Font.PLAIN, 15));
		mChartTheme.setRegularFont(new Font("宋体", Font.PLAIN, 15));
		ChartFactory.setChartTheme(mChartTheme);
		XYSeriesCollection mCollection = GetCollection();
		JFreeChart mChart = ChartFactory.createXYLineChart("折线图", "X", "Y",
				mCollection, PlotOrientation.VERTICAL, true, true, false);
		ChartFrame mChartFrame = new ChartFrame("折线图", mChart);
		mChartFrame.pack();
		mChartFrame.setVisible(true);
	}

	public static XYSeriesCollection GetCollection() {
		XYSeriesCollection mCollection = new XYSeriesCollection();
		XYSeries mSeriesFirst = new XYSeries("First");
		mSeriesFirst.add(1.0D, 1.0D);
		mSeriesFirst.add(2D, 4D);
		mSeriesFirst.add(3D, 3D);
		mSeriesFirst.add(4D, 5D);
		mSeriesFirst.add(5D, 5D);
		mSeriesFirst.add(6D, 7D);
		mSeriesFirst.add(7D, 7D);
		mSeriesFirst.add(8D, 8D);
		XYSeries mSeriesSecond = new XYSeries("Second");
		mSeriesSecond.add(1.0D, 5D);
		mSeriesSecond.add(2D, 7D);
		mSeriesSecond.add(3D, 6D);
		mSeriesSecond.add(4D, 8D);
		mSeriesSecond.add(5D, 4D);
		mSeriesSecond.add(6D, 4D);
		mSeriesSecond.add(7D, 2D);
		mSeriesSecond.add(8D, 1.0D);
		mCollection.addSeries(mSeriesFirst);
		mCollection.addSeries(mSeriesSecond);
		return mCollection;
	}
}
结果展示:
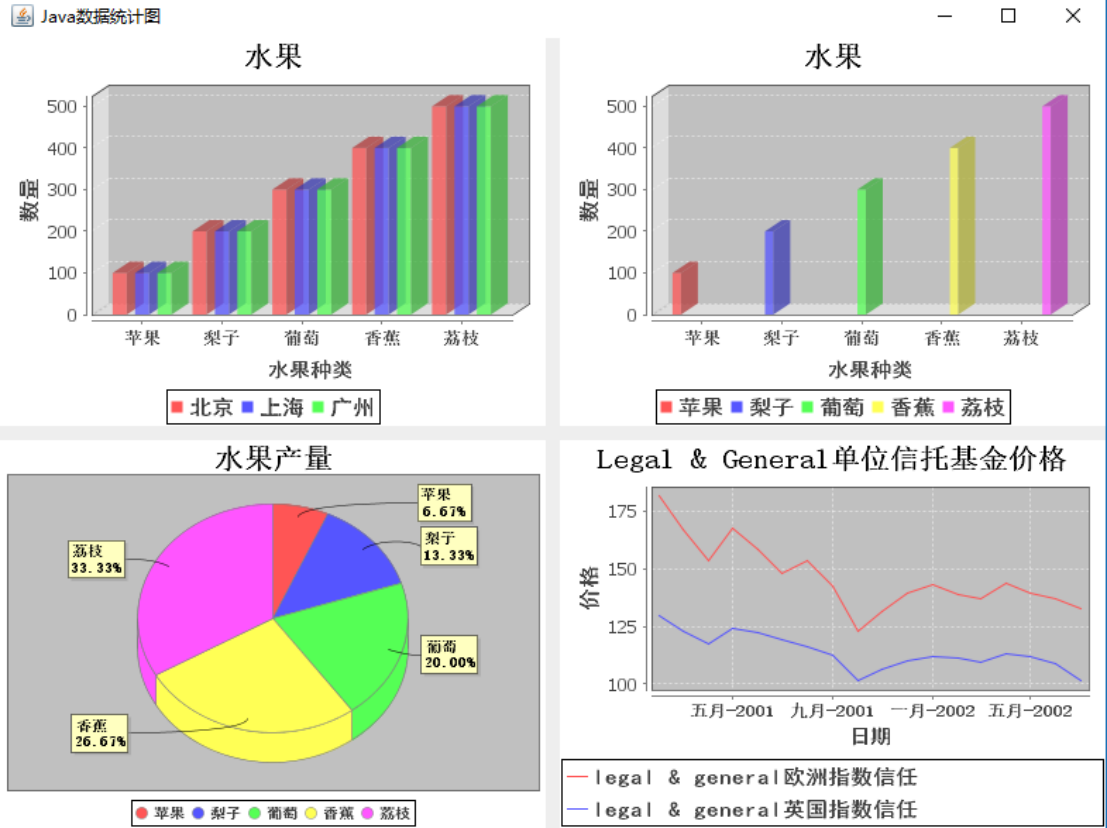
🔗案例5:综合案例
// 1.柱状图
class BarChart {
	ChartPanel frame1;
	int choose;// 用户选择
	public BarChart(int choose) {
		this.choose = choose;
		CategoryDataset dataset = getDataSet(this.choose);
		JFreeChart chart = ChartFactory.createBarChart3D("水果", // 图表标题
				"水果种类", // 目录轴的显示标签
				"数量", // 数值轴的显示标签
				dataset, // 数据集
				PlotOrientation.VERTICAL, // 图表方向:水平、垂直
				true, // 是否显示图例(对于简单的柱状图必须是false)
				false, // 是否生成工具
				false // 是否生成URL链接
				);

		// 从这里开始
		CategoryPlot plot = chart.getCategoryPlot();// 获取图表区域对象
		CategoryAxis domainAxis = plot.getDomainAxis(); // 水平底部列表
		domainAxis.setLabelFont(new Font("黑体", Font.BOLD, 14)); // 水平底部标题
		domainAxis.setTickLabelFont(new Font("宋体", Font.BOLD, 12)); // 垂直标题
		ValueAxis rangeAxis = plot.getRangeAxis();// 获取柱状
		rangeAxis.setLabelFont(new Font("黑体", Font.BOLD, 15));
		chart.getLegend().setItemFont(new Font("黑体", Font.BOLD, 15));
		chart.getTitle().setFont(new Font("宋体", Font.BOLD, 20));// 设置标题字体

		frame1 = new ChartPanel(chart, true); // 这里也可以用chartFrame,可以直接生成一个独立的Frame

	}

	private static CategoryDataset getDataSet(int i) {
		// 根据不同的用户选择显示不同的内容
		DefaultCategoryDataset dataset = new DefaultCategoryDataset();
		if (i == 0) {
			dataset.addValue(100, "北京", "苹果");
			dataset.addValue(100, "上海", "苹果");
			dataset.addValue(100, "广州", "苹果");
			dataset.addValue(200, "北京", "梨子");
			dataset.addValue(200, "上海", "梨子");
			dataset.addValue(200, "广州", "梨子");
			dataset.addValue(300, "北京", "葡萄");
			dataset.addValue(300, "上海", "葡萄");
			dataset.addValue(300, "广州", "葡萄");
			dataset.addValue(400, "北京", "香蕉");
			dataset.addValue(400, "上海", "香蕉");
			dataset.addValue(400, "广州", "香蕉");
			dataset.addValue(500, "北京", "荔枝");
			dataset.addValue(500, "上海", "荔枝");
			dataset.addValue(500, "广州", "荔枝");
		} else if (i == 1) {
			dataset.addValue(100, "苹果", "苹果");
			dataset.addValue(200, "梨子", "梨子");
			dataset.addValue(300, "葡萄", "葡萄");
			dataset.addValue(400, "香蕉", "香蕉");
			dataset.addValue(500, "荔枝", "荔枝");
		}
		return dataset;
	}

	public ChartPanel getChartPanel() {
		return frame1;
	}
}

// 饼状图
class PieChart {
	ChartPanel frame1;

	public PieChart() {
		DefaultPieDataset data = getDataSet();
		JFreeChart chart = ChartFactory.createPieChart3D("水果产量", data, true,
				false, false);
		// 设置百分比
		PiePlot pieplot = (PiePlot) chart.getPlot();
		DecimalFormat df = new DecimalFormat("0.00%");// 获得一个DecimalFormat对象,主要是设置小数问题
		NumberFormat nf = NumberFormat.getNumberInstance();// 获得一个NumberFormat对象
		StandardPieSectionLabelGenerator sp1 = new StandardPieSectionLabelGenerator(
				"{0}  {2}", nf, df);// 获得StandardPieSectionLabelGenerator对象
		pieplot.setLabelGenerator(sp1);// 设置饼图显示百分比

		// 没有数据的时候显示的内容
		pieplot.setNoDataMessage("无数据显示");
		pieplot.setCircular(false);
		pieplot.setLabelGap(0.02D);

		pieplot.setIgnoreNullValues(true);// 设置不显示空值
		pieplot.setIgnoreZeroValues(true);// 设置不显示负值
		frame1 = new ChartPanel(chart, true);
		chart.getTitle().setFont(new Font("宋体", Font.BOLD, 20));// 设置标题字体
		PiePlot piePlot = (PiePlot) chart.getPlot();// 获取图表区域对象
		piePlot.setLabelFont(new Font("宋体", Font.BOLD, 10));// 解决乱码
		chart.getLegend().setItemFont(new Font("黑体", Font.BOLD, 10));
	}

	private static DefaultPieDataset getDataSet() {
		DefaultPieDataset dataset = new DefaultPieDataset();
		dataset.setValue("苹果", 100);
		dataset.setValue("梨子", 200);
		dataset.setValue("葡萄", 300);
		dataset.setValue("香蕉", 400);
		dataset.setValue("荔枝", 500);
		return dataset;
	}

	public ChartPanel getChartPanel() {
		return frame1;

	}
}

// 3.折线图
class TimeSeriesChart {
	ChartPanel frame1;

	public TimeSeriesChart() {
		XYDataset xydataset = createDataset();
		JFreeChart jfreechart = ChartFactory.createTimeSeriesChart(
				"Legal & General单位信托基金价格", "日期", "价格", xydataset, true, true,
				true);
		XYPlot xyplot = (XYPlot) jfreechart.getPlot();
		DateAxis dateaxis = (DateAxis) xyplot.getDomainAxis();
		dateaxis.setDateFormatOverride(new SimpleDateFormat("MMM-yyyy"));
		frame1 = new ChartPanel(jfreechart, true);
		dateaxis.setLabelFont(new Font("黑体", Font.BOLD, 14)); // 水平底部标题
		dateaxis.setTickLabelFont(new Font("宋体", Font.BOLD, 12)); // 垂直标题
		ValueAxis rangeAxis = xyplot.getRangeAxis();// 获取柱状
		rangeAxis.setLabelFont(new Font("黑体", Font.BOLD, 15));
		jfreechart.getLegend().setItemFont(new Font("黑体", Font.BOLD, 15));
		jfreechart.getTitle().setFont(new Font("宋体", Font.BOLD, 20));// 设置标题字体
	}

	private static XYDataset createDataset() { // 这个数据集有点多,但都不难理解
		TimeSeries timeseries = new TimeSeries("legal & general欧洲指数信任",
				org.jfree.data.time.Month.class);
		timeseries.add(new Month(2, 2001), 181.80000000000001D);
		timeseries.add(new Month(3, 2001), 167.30000000000001D);
		timeseries.add(new Month(4, 2001), 153.80000000000001D);
		timeseries.add(new Month(5, 2001), 167.59999999999999D);
		timeseries.add(new Month(6, 2001), 158.80000000000001D);
		timeseries.add(new Month(7, 2001), 148.30000000000001D);
		timeseries.add(new Month(8, 2001), 153.90000000000001D);
		timeseries.add(new Month(9, 2001), 142.69999999999999D);
		timeseries.add(new Month(10, 2001), 123.2D);
		timeseries.add(new Month(11, 2001), 131.80000000000001D);
		timeseries.add(new Month(12, 2001), 139.59999999999999D);
		timeseries.add(new Month(1, 2002), 142.90000000000001D);
		timeseries.add(new Month(2, 2002), 138.69999999999999D);
		timeseries.add(new Month(3, 2002), 137.30000000000001D);
		timeseries.add(new Month(4, 2002), 143.90000000000001D);
		timeseries.add(new Month(5, 2002), 139.80000000000001D);
		timeseries.add(new Month(6, 2002), 137D);
		timeseries.add(new Month(7, 2002), 132.80000000000001D);
		TimeSeries timeseries1 = new TimeSeries("legal & general英国指数信任",
				org.jfree.data.time.Month.class);
		timeseries1.add(new Month(2, 2001), 129.59999999999999D);
		timeseries1.add(new Month(3, 2001), 123.2D);
		timeseries1.add(new Month(4, 2001), 117.2D);
		timeseries1.add(new Month(5, 2001), 124.09999999999999D);
		timeseries1.add(new Month(6, 2001), 122.59999999999999D);
		timeseries1.add(new Month(7, 2001), 119.2D);
		timeseries1.add(new Month(8, 2001), 116.5D);
		timeseries1.add(new Month(9, 2001), 112.7D);
		timeseries1.add(new Month(10, 2001), 101.5D);
		timeseries1.add(new Month(11, 2001), 106.09999999999999D);
		timeseries1.add(new Month(12, 2001), 110.3D);
		timeseries1.add(new Month(1, 2002), 111.7D);
		timeseries1.add(new Month(2, 2002), 111D);
		timeseries1.add(new Month(3, 2002), 109.59999999999999D);
		timeseries1.add(new Month(4, 2002), 113.2D);
		timeseries1.add(new Month(5, 2002), 111.59999999999999D);
		timeseries1.add(new Month(6, 2002), 108.8D);
		timeseries1.add(new Month(7, 2002), 101.59999999999999D);
		TimeSeriesCollection timeseriescollection = new TimeSeriesCollection();
		timeseriescollection.addSeries(timeseries);
		timeseriescollection.addSeries(timeseries1);
		return timeseriescollection;
	}

	public ChartPanel getChartPanel() {
		return frame1;
	}
}

public class MainTest {
	public static void main(String args[]) {
		JFrame frame = new JFrame("Java数据统计图");
		frame.setLayout(new GridLayout(2, 2, 10, 10));
		frame.add(new BarChart(0).getChartPanel()); // 添加柱形图
		frame.add(new BarChart(1).getChartPanel()); // 添加柱形图的另一种效果
		frame.add(new PieChart().getChartPanel()); // 添加饼状图
		frame.add(new TimeSeriesChart().getChartPanel()); // 添加折线图
		frame.setBounds(50, 50, 800, 600);
		frame.setVisible(true);
	}
}
结果展示:
【3】开发参考
🔩常用设置
// 设置线条、数据点颜色和显示属性
CategoryPlot mPlot = (CategoryPlot)mChart.getPlot();
mPlot.setBackgroundPaint(Color.WHITE);// 设置绘图区背景色
mPlot.setRangeGridlinePaint(Color.BLUE);//背景底部横虚线
mPlot.setOutlinePaint(Color.RED);//边界线
mPlot.setDomainGridlinePaint(Color.BLUE); // 设置垂直方向背景线颜色
mPlot.setDomainGridlinesVisible(true); // 设置是否显示垂直方向背景线,默认值为false
LineAndShapeRenderer lasp = (LineAndShapeRenderer) mPlot.getRenderer();// 获取显示线条的对象
lasp.setBaseShapesVisible(true);// 设置拐点是否可见/是否显示拐点
lasp.setDrawOutlines(true);// 设置拐点不同用不同的形状
lasp.setUseFillPaint(true);// 设置线条是否被显示填充颜色
lasp.setBaseFillPaint(Color.BLACK);//// 设置拐点颜色
//lasp.setSeriesPaint(series, paint);
❓解决中文显示乱码问题
根据不同图表的显示设置相应的属性即可
(1)柱状图
JFreeChart jFreeChart = ...;  // 需要初始化
jFreeChart.getTitle().setFont(new Font("隶书", Font.ITALIC, 15));//设置标题
//设置图例类别字体
jFreeChart.getLegend().setItemFont(new Font("宋体", Font.BOLD, 15));
jFreeChart.setBackgroundPaint(Color.WHITE);
CategoryPlot categoryPlot=jFreeChart.getCategoryPlot();//用于设置显示特性
categoryPlot.setBackgroundPaint(Color.WHITE);
categoryPlot.setDomainGridlinePaint(Color.BLACK);//分类轴网格线条颜色
categoryPlot.setDomainGridlinesVisible(true);
categoryPlot.setRangeGridlinePaint(Color.GREEN);//数据轴网格线条颜色

CategoryAxis domainAxis=categoryPlot.getDomainAxis(); //水平底部列表
domainAxis.setLabelFont(new Font("黑体",Font.BOLD,14)); //水平底部标题
domainAxis.setTickLabelFont(new Font("宋体",Font.BOLD,12)); //垂直标题
ValueAxis rangeAxis=categoryPlot.getRangeAxis();//获取柱状
rangeAxis.setLabelFont(new Font("黑体",Font.BOLD,15)); //设置柱状标题
(2)折线图
JFreeChart jFreeChart = ...;  // 需要初始化
Font titleFont = new Font("隶书", Font.ITALIC, 18);
Font font = new Font("宋体", Font.BOLD, 12);
Font legendFont = new Font("宋体", Font.BOLD, 15);
jFreeChart.getTitle().setFont(titleFont);
jFreeChart.getLegend().setItemFont(legendFont);

CategoryPlot plot = jFreeChart.getCategoryPlot();
plot.getDomainAxis().setLabelFont(font);
plot.getDomainAxis().setTickLabelFont(font);
plot.getRangeAxis().setLabelFont(font);
(3)饼状图
JFreeChart jFreeChart = ...;  // 需要初始化
Font titleFont=new Font("隶书", Font.ITALIC, 18);
Font font=new Font("宋体",Font.BOLD,12);
Font legendFont=new Font("宋体", Font.BOLD, 15);

jFreeChart.getTitle().setFont(titleFont);
jFreeChart.getLegend().setItemFont(legendFont);

PiePlot plot=(PiePlot)jFreeChart.getPlot();
plot.setLabelFont(font);
❓常见问题
导出数据图片的时候抛出空指针异常,如果是通过File类型导出图片数据,则需要判断文件是否存在,如果文件不存在,相应地要创建新的文件。其次,如果是导出图片数据与显示图片数据到JFrame窗体中要注意先后顺序,先导出图片文件随后再显示数据到窗体中